Introduction
Dead letter queues (DLQ) are often used to catch items that have not been successfully processed or delivered when using queue 1 based integration patterns.
Typically engineering teams will want to be alerted quickly to the presence of items on a dead letter queue so they can do something about it e.g. redrive messages back to a source queue, inspect the messages for further understanding of an issue etc.
In this post we’ll discuss how we lost messages that had been placed on a dead-letter queue, how we have learnt from this experience and what we have done to improve our processes.
Background
Using a source queue and a DLQ
In a typical setup you may have:
- A source queue holding messages that need to be processed
- A handler that can consume messages from the queue and attempt to process them
- A dead-letter queue that can hold messages that can not be processed
- A means of alerting a human when messages are placed on the DLQ
![The message handler [2] invokes an external API. If the API is unavailable messages will end up on the DLQ, triggering an alarm.](images/queue-with-dlq-and-alarm.png)
The message handler [2] invokes an external API. If the API is unavailable messages will end up on the DLQ, triggering an alarm.
You may not be able to process every message
When handling a message various scenarios can result in not being unable to complete processing e.g.
- the content of a message is invalid
- you have a defect in the handler
- a dependency, such as a HTTP API, is unavailable
You may configure your implementation to retry the processing of a failed message multiple times, but at some point you will decide that it can not be handled and place it on a separate dead-letter queue [3].
At this point you probably want to alert a human [4] who can investigate and take appropriate action to resolve the situation.
Handling items on a dead-letter queue
We don’t want items appearing on our DLQ as it means something has gone wrong and remediating action may need to be taken. This could include:
Move items back to the source queue
If your messages were moved to the DLQ because a dependency was temporarily unavailable then you may just need to move the messages back onto the source queue (once the dependency is available) so they can be processed again.
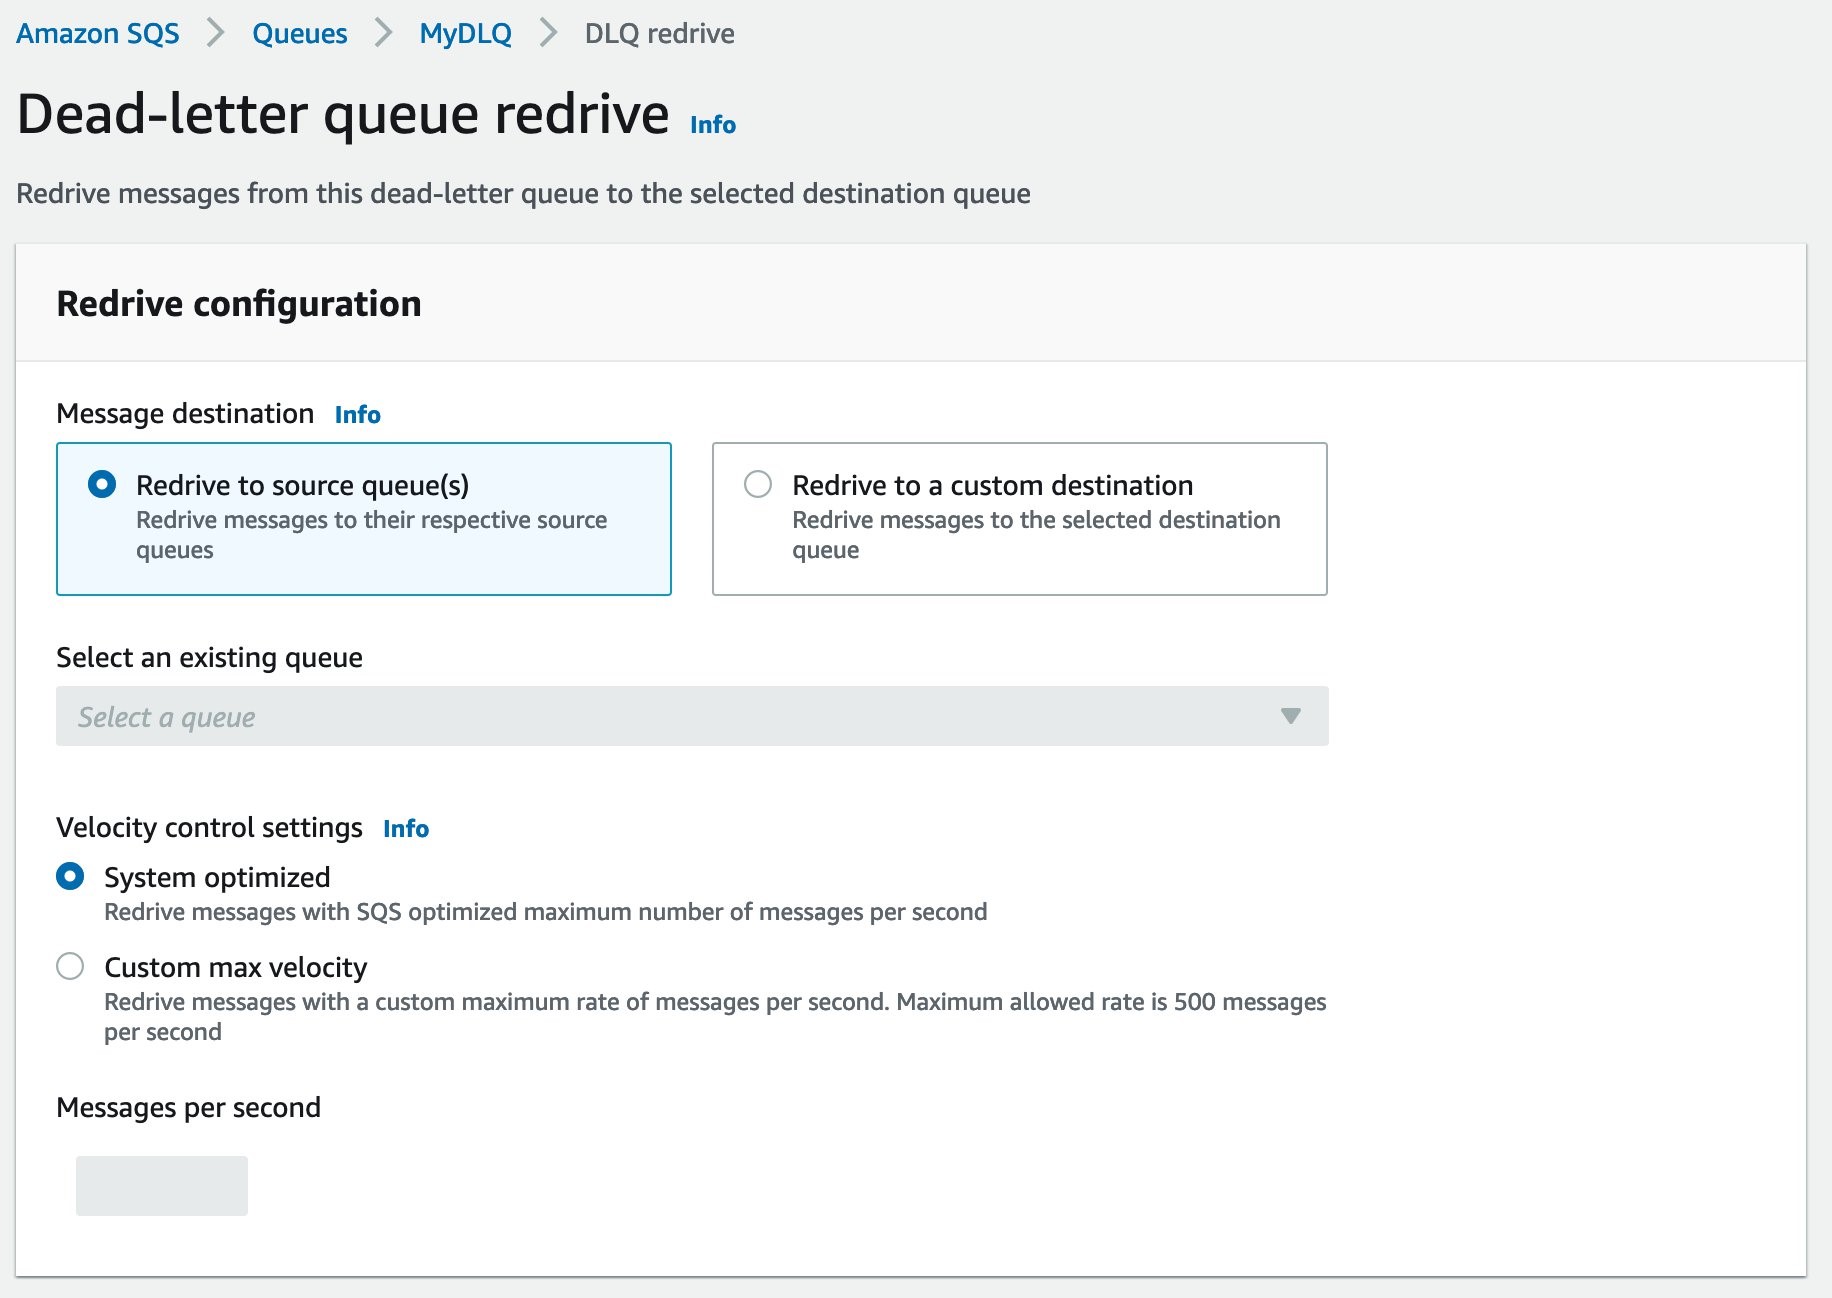
If you’re using AWS, and have the appropriate permissions, source queue re-drive can be achieved through the AWS console. This capability is not exposed through an API so may be something you need to implement yourself if the console is not an option in a production environment.
Inspecting messages to understand what has gone wrong
You could also use a utility like the DVLA aws-sqs-utility to read message from the DLQ and inspect them to further understand an issue or defect. In some scenarios it may be appropriate to edit a message before moving it back onto the source queue.
Think about your DLQ processes when designing your solution
Other scenarios and queuing services may require a different approach and you should think about, and test, this, and the permissions required, while designing your solution, especially if the processing of items is time sensitive. The permissions required could include read and write permissions for multiple queues and being able to decrypt and encrypt messages.
AWS SQS and maximum message retention
SQS has a maximum message retention period of 14 days

We use AWS SQS for both source queues and a dead-letter queues and SQS has a maximum message retention period of fourteen days. Once a message has sat on a queue for this duration the message will be deleted.
In general fourteen days is more then adequate for message processing, even accounting for retries and backoff.
Messages can sit on a DLQ waiting for action to be taken
But what happens when your message sits on a DLQ waiting for a human to take action?
- If a human is alerted quickly and takes appropriate action within fourteen days then everything is fine
- If a human is not alerted quickly, or does not take appropriate action, then the message is going to sit on the queue until it is deleted and lost forever
How we lost some messages
You can probably work this out by now but:
- 👎 20+ critical messages landed on a SQS DLQ
- 👍 a CloudWatch alarm was triggered
- 👍 a human was alerted quickly via a PagerDuty alert
- 👍 a human looked at the incident
- 👎 but the human did not take appropriate action
- ⌛ the messages sat on the queue for 14 days
- 💀 the messages hit the maximum retention limit and were deleted
- ⌛ we didn’t discover this until several weeks later
It’s not about blaming the human
Humans make mistakes, defects will make it to production, this is ok, its going to happen, its not about blame and this is how we learn and gain experience.
What is important is how you respond and how you identify and implement actions to avoid repeating the same mistake again.
What happened next
This time we were lucky, we were able to perform reconciliation activities and recreate the lost messages.
This involved verifying that each source record from this period had been processed by the target system. For any records that had not been processed we were able to recreate the lost message, using the data in the source record, and complete processing.
In another context this could have been far worse e.g.
- there may not have been a source record to aid with reconciliation, meaning the messages really were lost forever
- the volume of messages being handled, or period of data loss, could have been significantly greater requiring a far more significant effort to investigate and resolve
How we have improved our DLQ alerting
We don’t want to lose data, it is critical we are notified when messages land on a DLQ
Clearly we don’t want to lose messages, so we spent some time analysing what went wrong and what we could do to improve our alarms and alerting.
Understanding our DLQ alarm behaviour
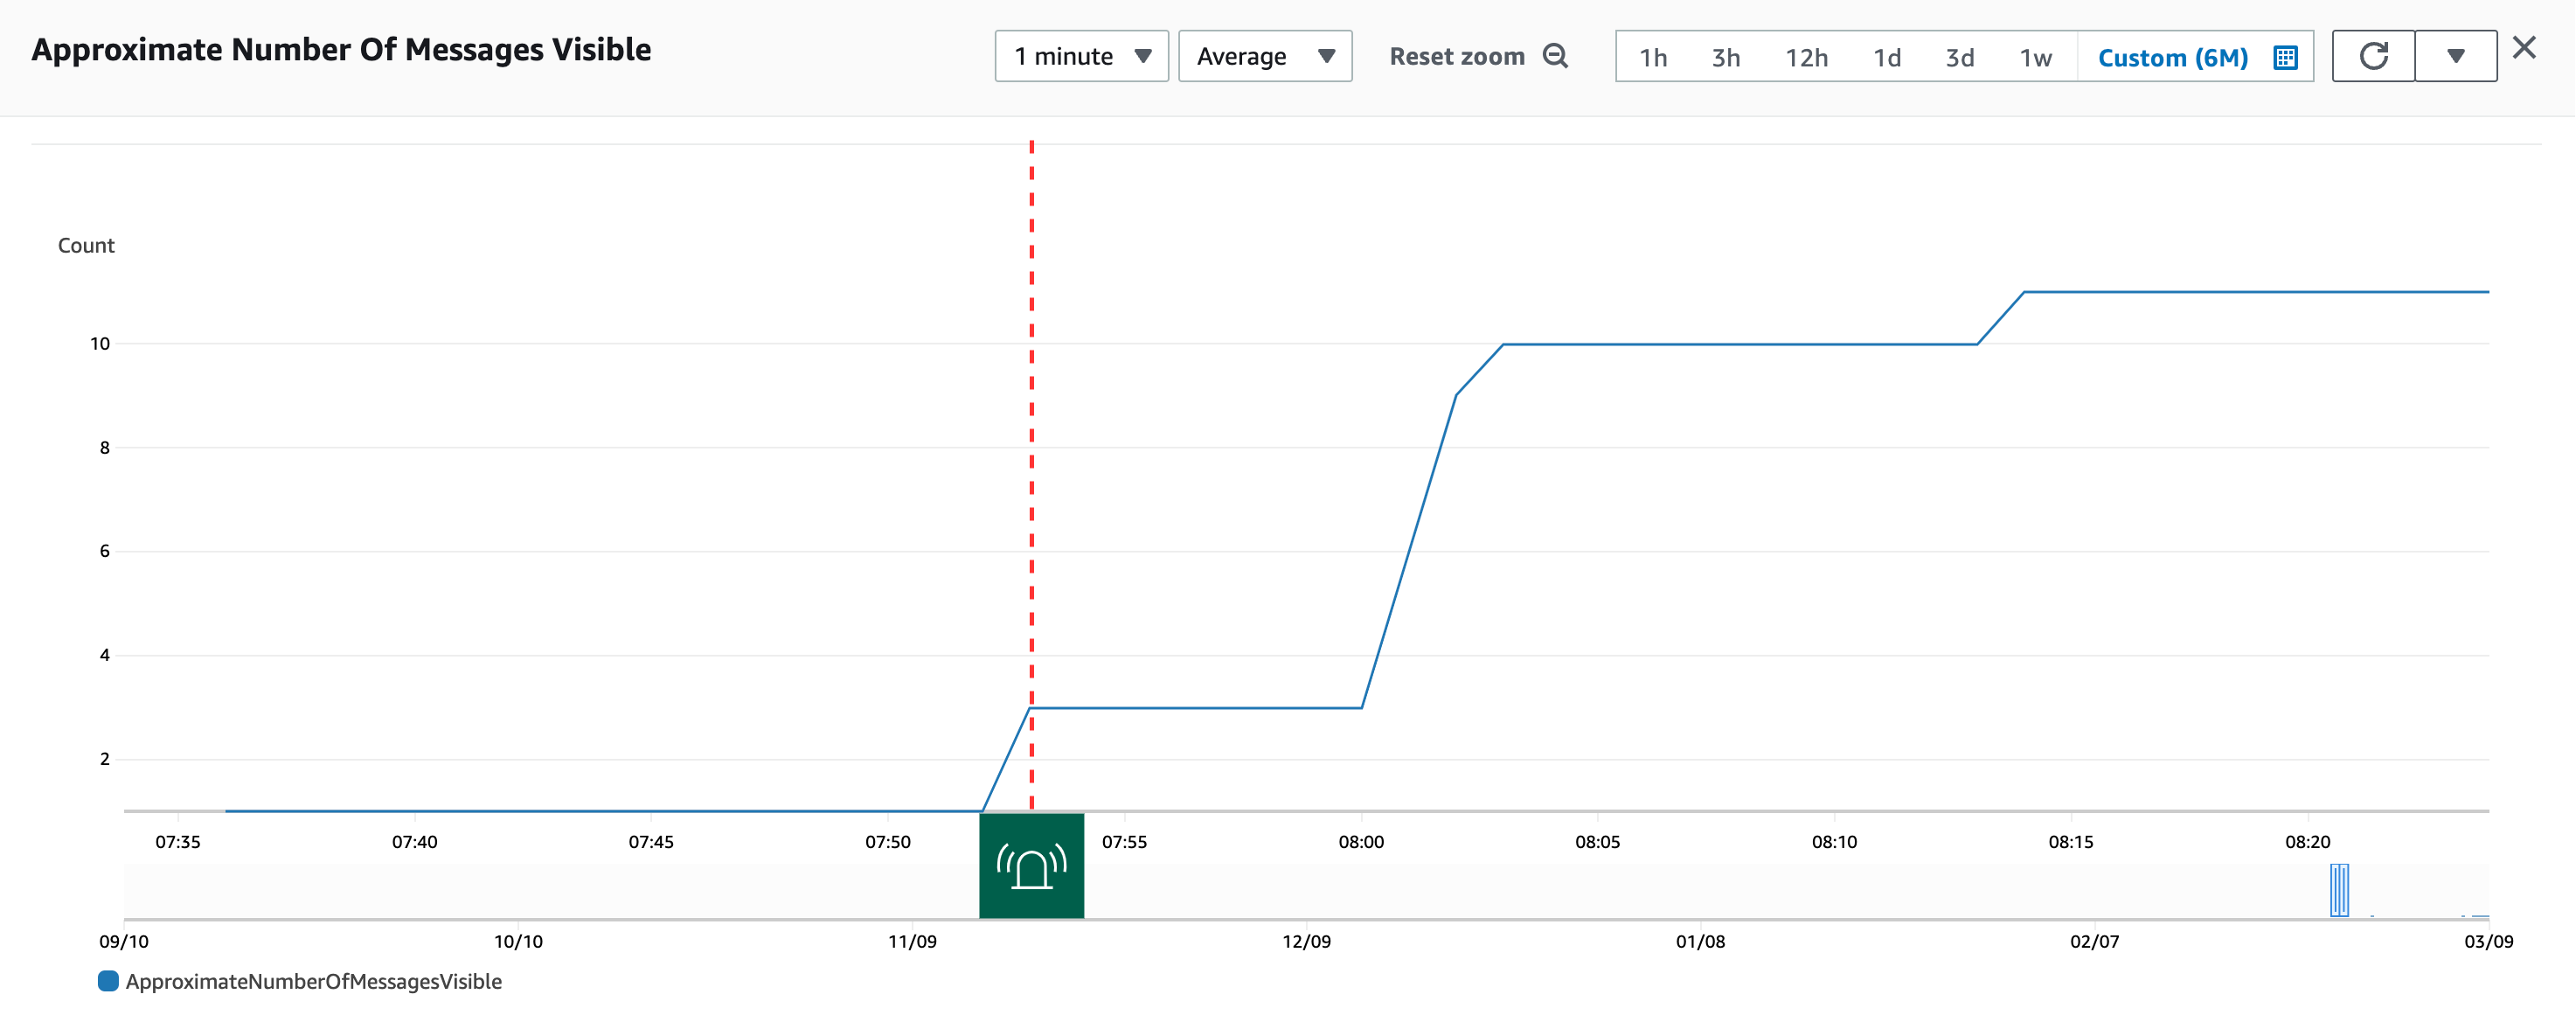
Our original alarm threshold was triggered once when messages were initially added to the queue.
Messages were added to the DLQ in distinct phases over a period of time but just a single alarm was triggered and a single incident raised.
This isn’t ideal so we asked ourselves how we could trigger multiple alarms to increase awarness of the issue and the likelihood of it being handled correctly.
How was our alarm configured?
The alarm threshold logic was:
if the number of messages on the DLQ is > 0 then raise an alarm
Which turned out to be a little naive causing just a single alarm to be triggered when the DLQ first moved to > 0.
We would not get any further alarms being triggered while the number of items on the queue remained above zero, even if messages were being added to the DLQ every 10 minutes for the next 4 weeks.
| Time | Error | DLQ Size | DLQ Size > 0 | Alarm State | Alert |
|---|---|---|---|---|---|
| 07:50 | - | 0 | - | OK | |
| 07:53 | ✔️ | 3 | ✔️ | ALARM | 🔔 |
| 08:00 | - | 3 | ✔️ | ALARM | |
| 08:02 | ✔️ | 10 | ✔️ | ALARM | |
| 08:10 | - | 10 | ✔️ | ALARM | |
| 08:13 | ✔️ | 11 | ✔️ | ALARM |
The alarm threshold was met once at 07:53 and entered an ALARM state, but never returned to an OK state so was never in a position to be triggered again.
Firing an alarm each time messages are added to the DLQ
We discussed the incident at one of our regular engineering community of practice meetings, both to raise awareness and to try and learn from each other. One of our teams shared their approach:
if the number of messages added to the DLQ in the last 5 minutes > 0 then raise an alarm
Which results in the alarm being triggered multiple times:
| Time | Error | DLQ Size | DLQ Size (5 mins) | Alarm State | Alert |
|---|---|---|---|---|---|
| 07:50 | - | 0 | 0 | OK | |
| 07:53 | ✔️ | 3 | 3 | ALARM | 🔔 |
| 08:00 | - | 3 | 0 | OK | |
| 08:02 | ✔️ | 10 | 7 | ALARM | 🔔 |
| 08:10 | - | 10 | 0 | OK | |
| 08:13 | ✔️ | 11 | 1 | ALARM | 🔔 |
The threshold is met at 07:53 entering an ALARM state then returns to OK within five minutes. This allows the threshold to crossed again when subsequent messages are added to the queue (08:02, 08:13). Much nicer.
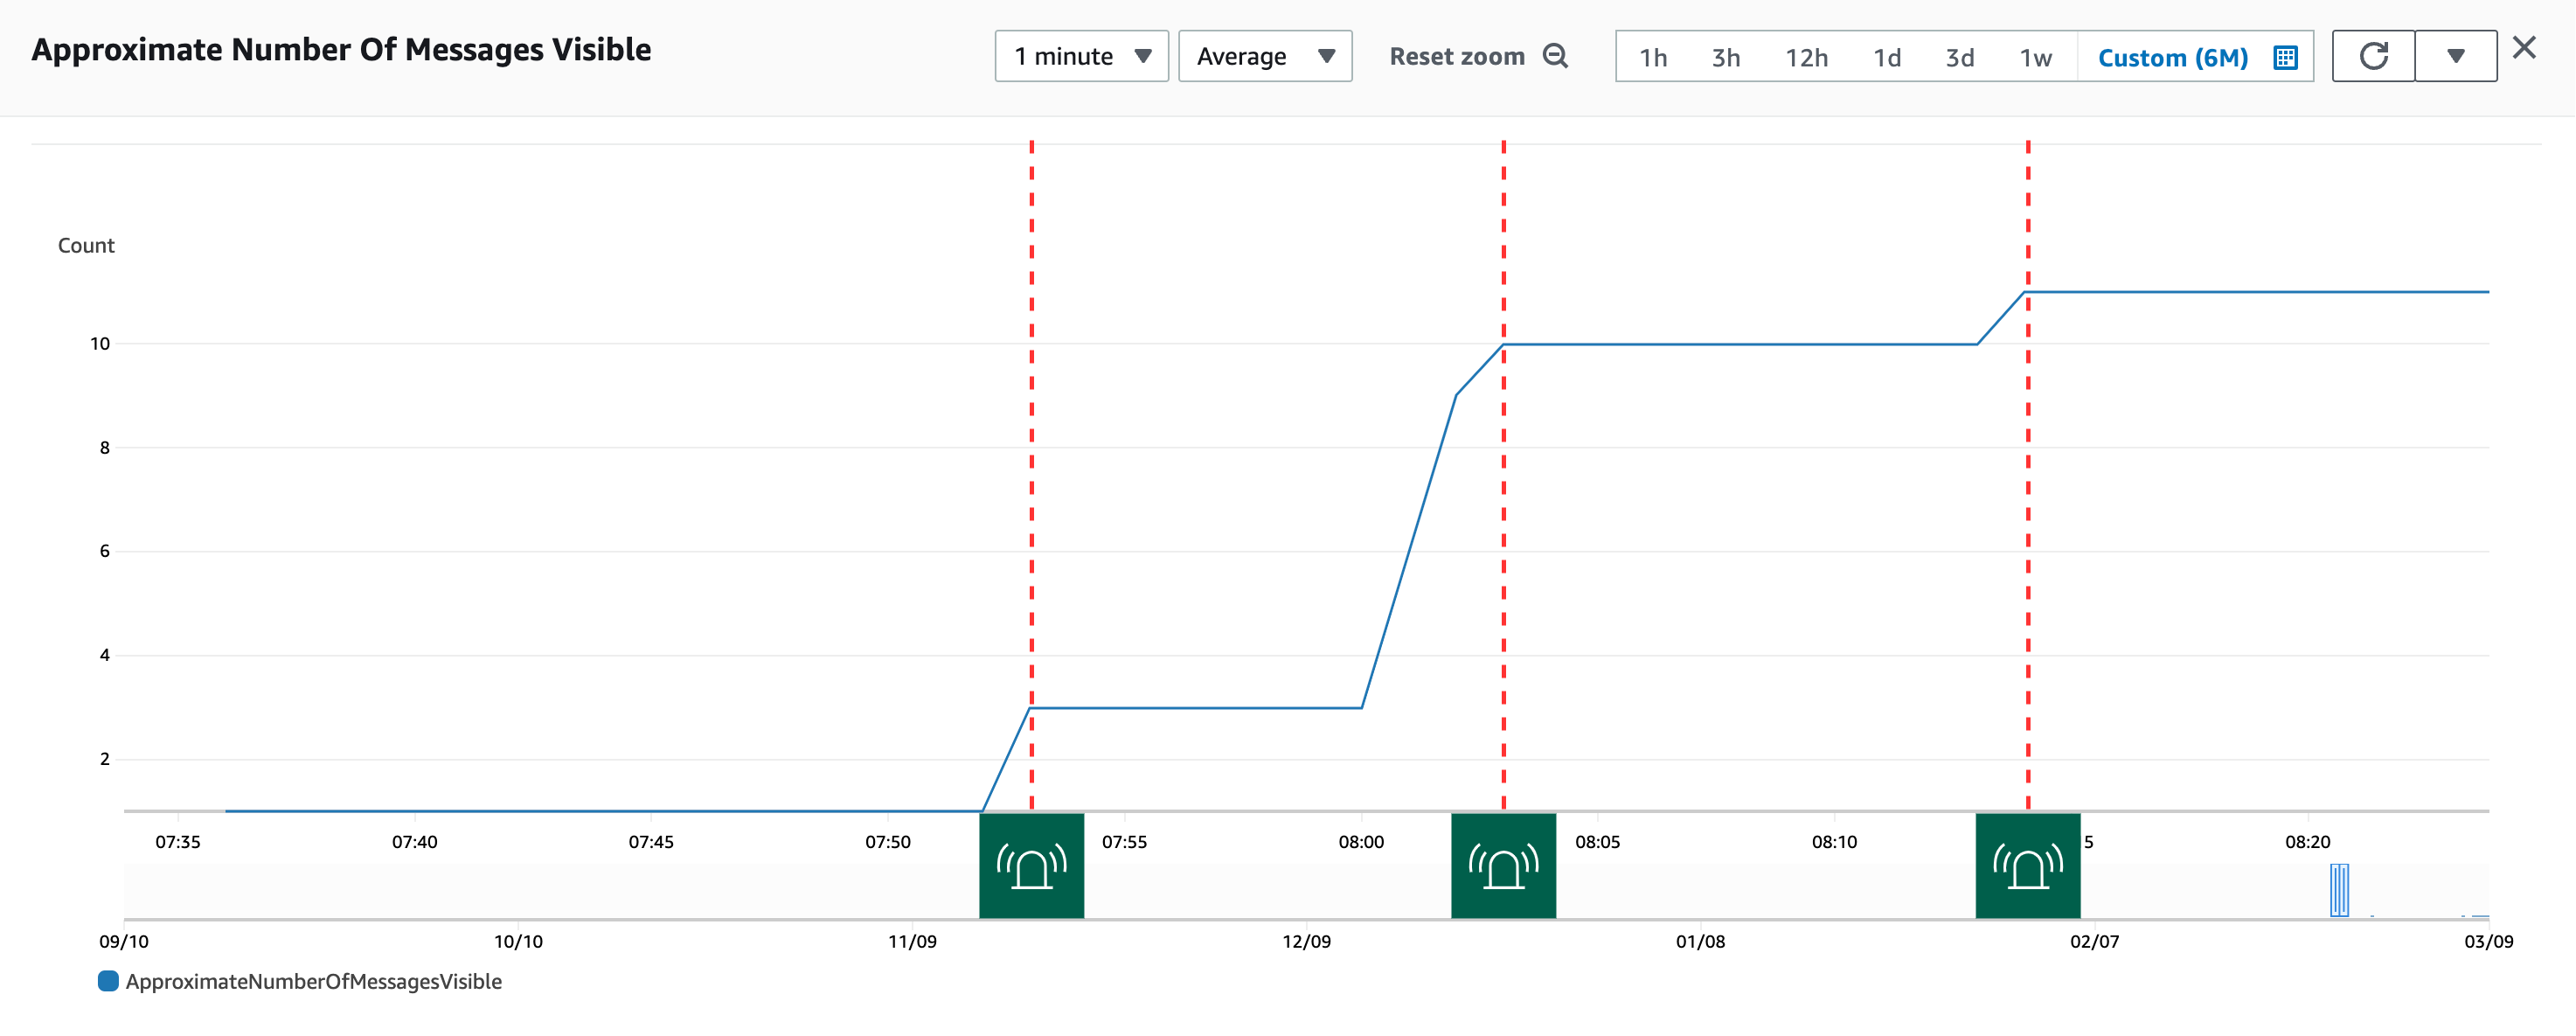
Now the alarm triggers multiple times.
If you want to set his up in Cloudwatch it will look something like this:
DLQueueAlarm:
    Type: AWS::CloudWatch::Alarm
    Properties:
        AlarmDescription: 'Message(s) added to the SMS DLQ in the last 5 minutes'
        Namespace: 'AWS/SQS'
        MetricName: NumberOfMessagesSent
        Dimensions:
        - Name: QueueName
            Value: 'my-dlq'
        Statistic: Sum
        Period: 60
        EvaluationPeriods: 5
        DatapointsToAlarm: 1
        Threshold: 1
        ComparisonOperator: GreaterThanOrEqualToThreshold
        AlarmActions:
        - Ref: DLQueueAlarmTopic
Update 2022-04-04 - it turns out that this example only works when manually adding messages to your DLQ (which you may do while testing the alarm). You can achieve something equivalent using
RATE(ApproximateNumberOfMessagesVisible)>0and I’ll update this example to reflect this ASAP.
Thanks to Sam Dengler for getting in touch to point this out. For more info see NumberOfMessagesSent does not increase as the result of a failure in the source queue
Firing an alarm every day if there are messages on the DLQ
We also thought about what we could do to minimise the impact of a human not handling an incident correctly and decided that it would be helpful to raise a new alert for each day that we had messages sat on a DLQ.
One of our developers came up with a really neat cloudwatch expression that makes this possible through simple config :
IF(HOUR(myDLQ)>7 AND HOUR(myDLQ)<9 AND myDLQ > 0, 1, 0)
Which will result in the alarm being triggered at around 7am each day if there are messages on the DLQ, even if no further messages have been added.
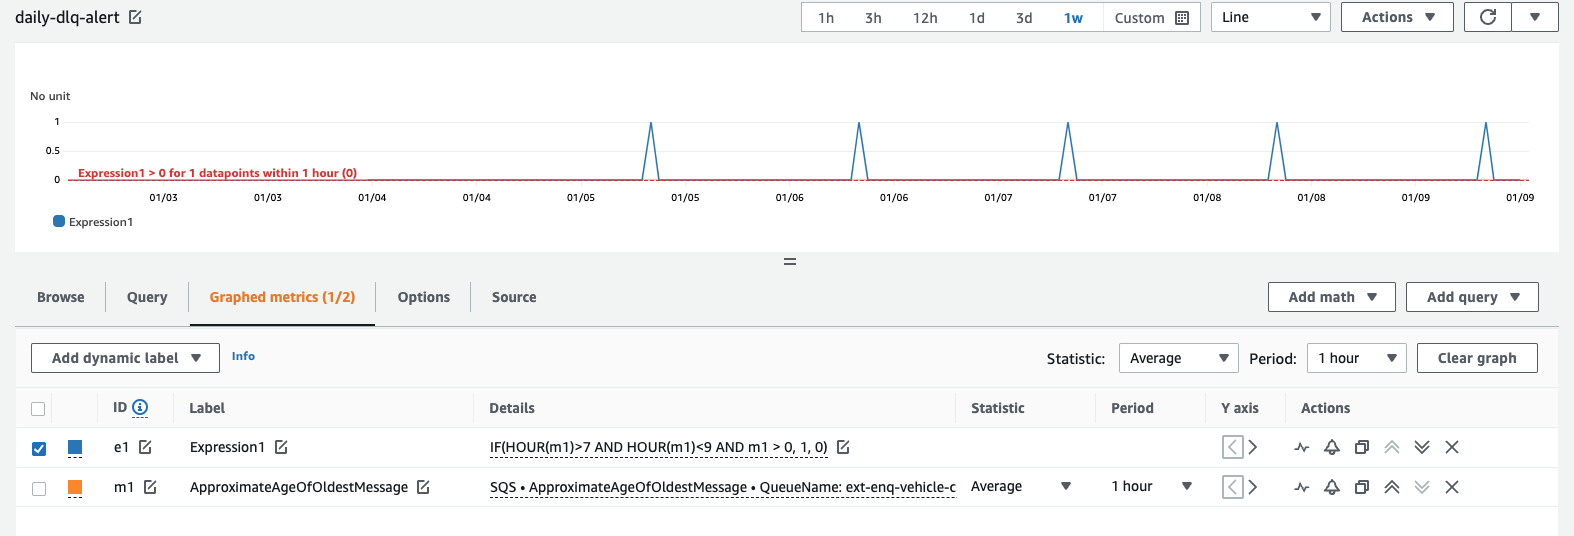
The expression means that the alarm enters an ALARM state at 7 and returns to OK at 9.
Kudos to Matthew Lewis for figuring this out 🙌
And in CloudFormation:
DLQDailyAlarm:
  Type: AWS::CloudWatch::Alarm
  Properties:
    ActionsEnabled: True
    AlarmActions:
      - arn:aws:sns:eu-west-2:1234567890:alert-topic
    AlarmDescription: Daily alarm for messages on DLQ
    AlarmName: 'dlq-daily-alarm'
    Metrics:
    - Id: summary
        Label: DLD Dead Letter Queues Alarm
        Expression: IF(HOUR(myDLQ)>7 AND HOUR(myDLQ)<9 AND myDLQ > 0, 1, 0)
        ReturnData: true
Looking at our PagerDuty integration
We use PagerDuty to manage incidents and alert engineers.
When integrating Cloudwatch alarms with PagerDuty to raise Alerts there are a few nuances to be aware of with this sort of alarm threshold.
Ok actions and auto-resolving alerts
When the number of messages added to the DQL within 5 minutes drops to zero the cloudwatch alarm will return to an OK state
If you integrate a Cloudwatch OK action with PagerDuty this will cause the PagerDuty Alert to be auto-resolved and closed before a human has had time to notice and take appropriate action.
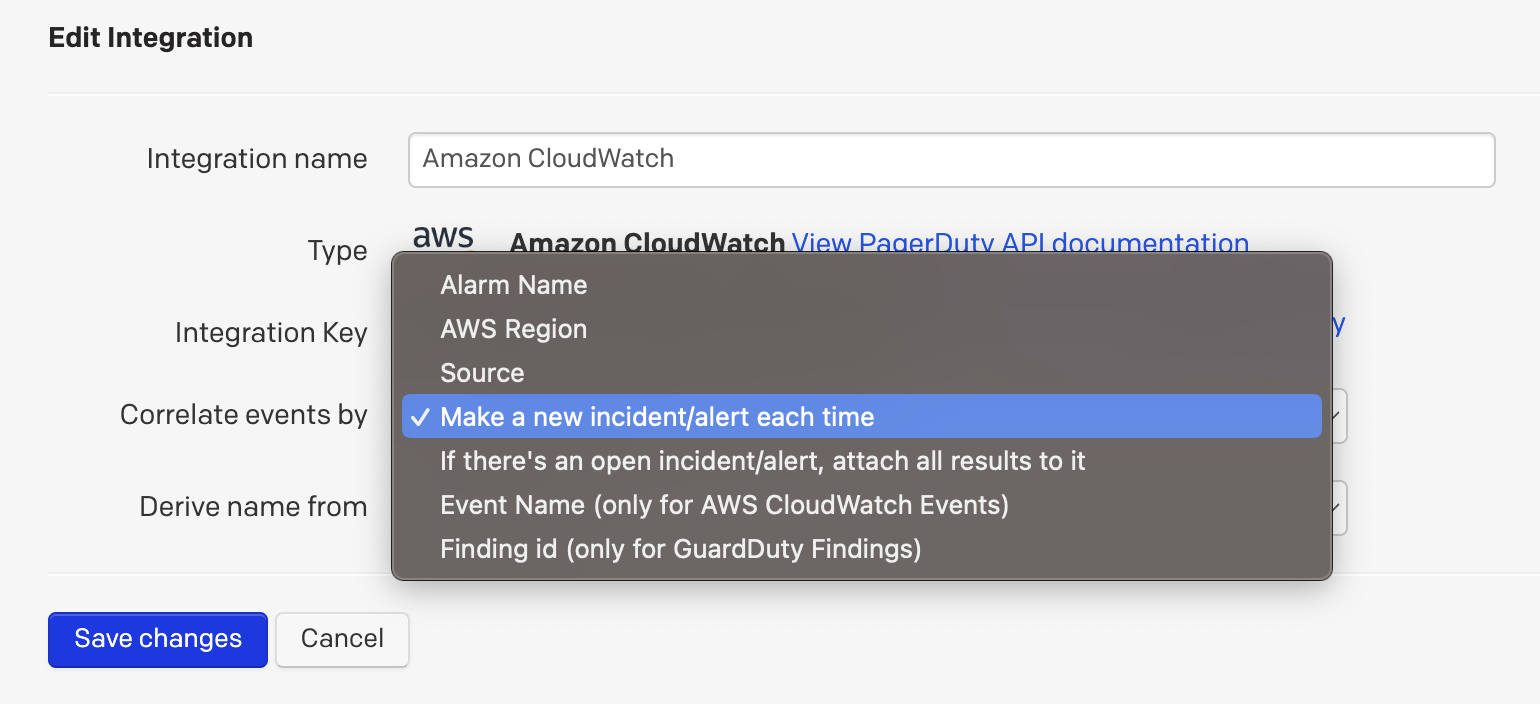
Configure alert correlation
To ensure that you raise a new alert each day you will need to configure how PagerDuty performs correlation. If you don’t do this you may find that your daily alarms are grouped together under the initial alert.
Correlate events by: Make a new incident/alert each time
Derive name from: Alarm Name
Other Improvements
Persisting a copy of our messages
We are also reviewing out patterns to ensure we can always persist a copy of a messages, or the data required to create a message, for a reasonable duration of time, which would help is scenarios like this.
This could include:
- ensuring we always write the data or a message into a database or other persistant store before writing to a queue
- using Amazon EventBridge instead of SQS as it has an archive and replay capability.
- adding Amazon SNS in front of SQS and using the fan-out pattern to archive messages in S3.
Summary
Hopefully this article will help you think a little more about how you are using DLQs and the processes you have in place to handle any messages that land on them.
All being well this isn’t someything you’ll have to do frequently but it may be worth reviewing your approach and what alarms or alerts you have in place.
To be more accurate DLQs are used within a wide range of service integration patterns (queues, buses, topics etc) and can be plugged into many cloud vendor managed services to help with processing or delivery failures. ↩︎